Data science · 2026
Su Ufku
A daily water outlook for İstanbul's dams that shows where the citywide reserve is heading over 30, 60 and 90 days as honest ranges, and in a 13-year hindcast misses by 3.7 points at 30 days, 35% less than "same day last year".
- points of fill, typical 30-day miss (hindcast, 2011–2023)
- 3.7
- smaller 30-day miss than same day last year
- 35%
- of outcomes inside the 80% range at 30 days (target: 80%)
- 85%
- past weeks re-forecast with only what was known then
- 679

Intended use
When İstanbul's dams run low, the news asks how many days of water are left, and the answers range from 45 to 125.
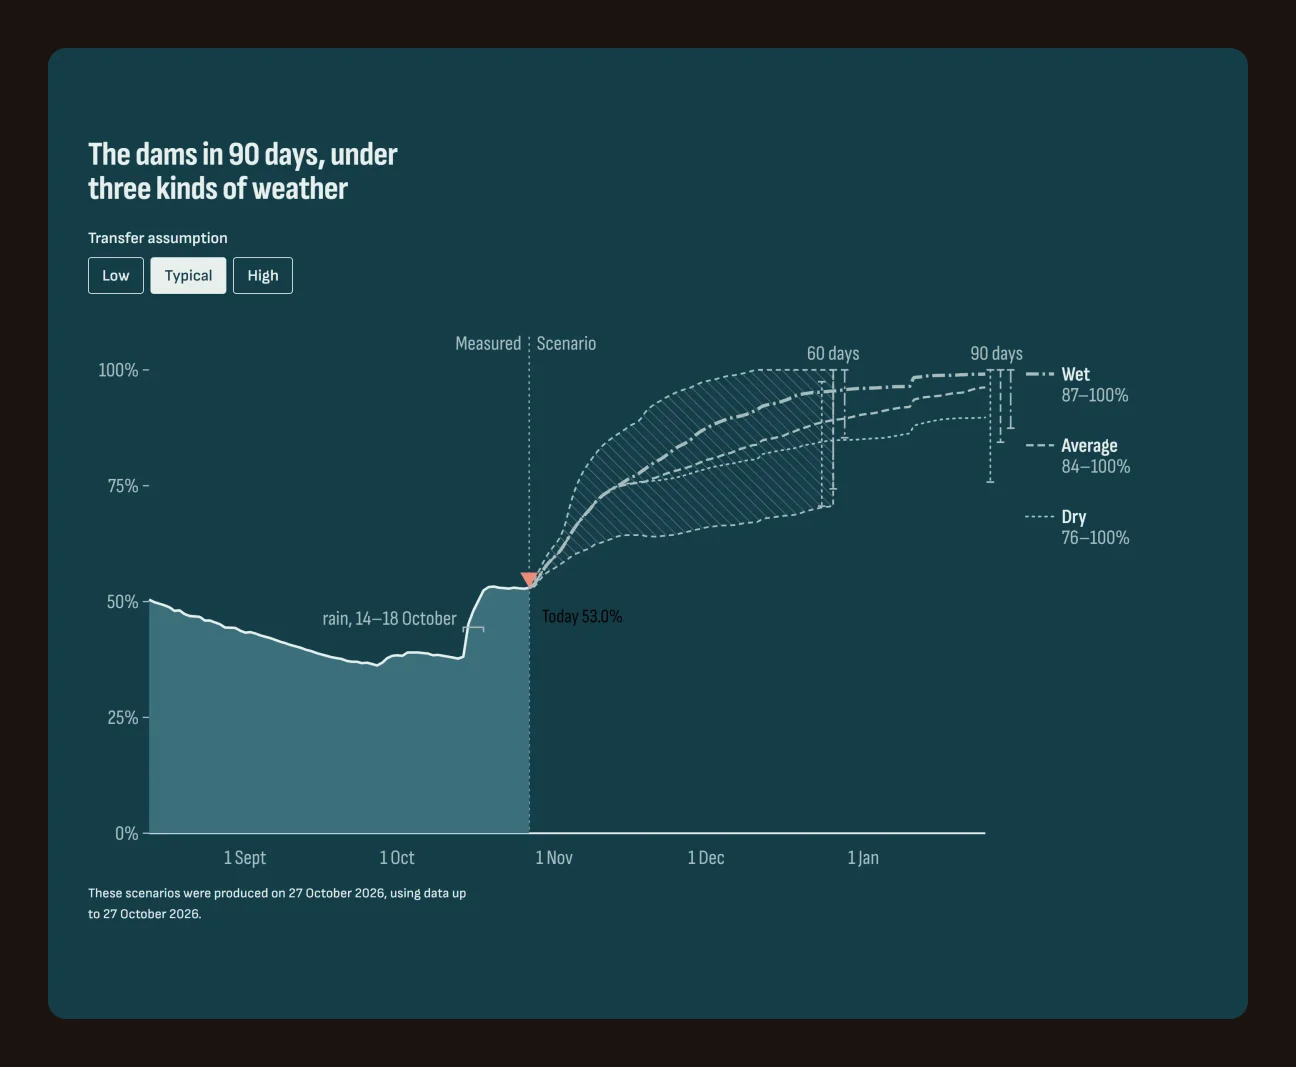
Su Ufku ("Water Horizon") is a public, daily-updated outlook for the city's ten dams. Every morning it shows today's level and where the citywide reserve is likely to be in 14 and 30 days, then dry, average and wet scenarios out to 90. It never names a day the water "runs out"; it shows how many days the usable water would last, as a range. Every forecast is archived and checked in public once its date has passed. The site is in Turkish first, with an English version.
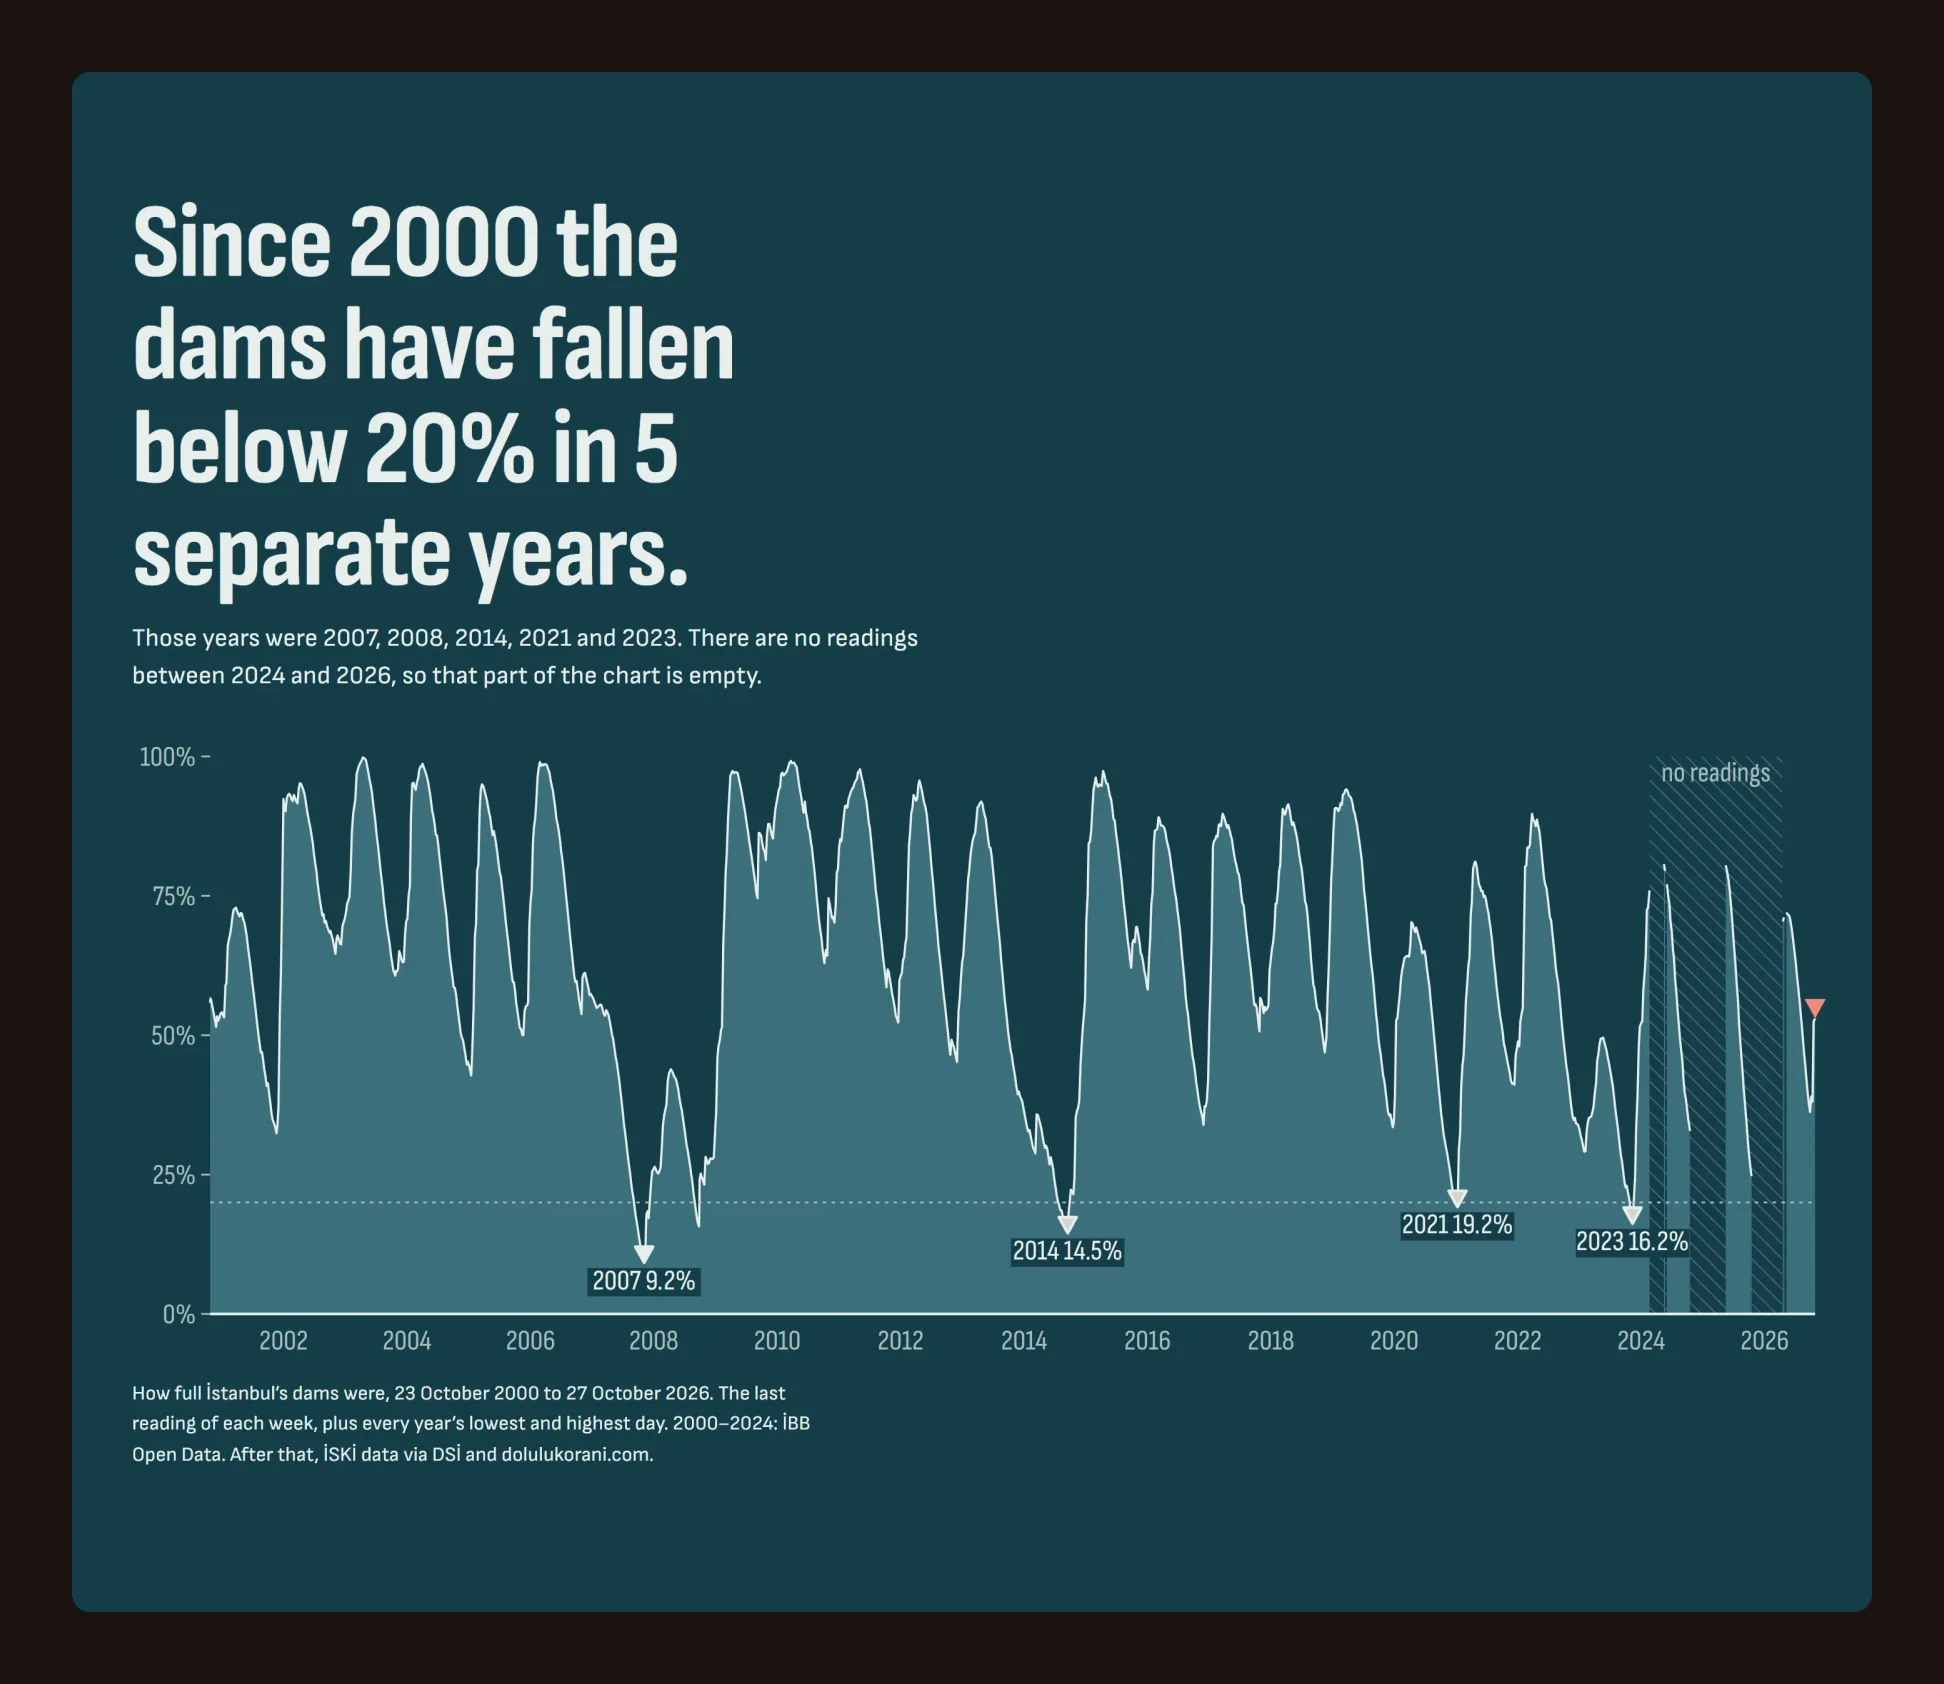
The hard part is the data, not the model. Sources disagree on dam sizes, there is a two-year hole in the daily record, and nobody publishes how much water sits unusable at the bottom of a dam, so the site shows both readings until İSKİ, the city's water authority, says which is right.
Architecture
Decisions
- A bathtub, not a neural net. A water balance (rain in, city use and evaporation out, pipeline transfers on top) beat a LightGBM model at every forecast length and in every season: 3.7 points off at 30 days against 4.3. It also explains itself in one sentence.
- Ranges over a single number. Days 1–14 use ECMWF's 51 weather runs. After that it replays each past year's weather from the same date. The ranges are widened from the model's own past misses, because without that they held only about half the outcomes.
- A bar set in advance. The long-range scenarios only ship while the model beats "same day last year" at 30 days. A quarterly retrain has to pass the same gate, plus the tests, before it replaces the current model.
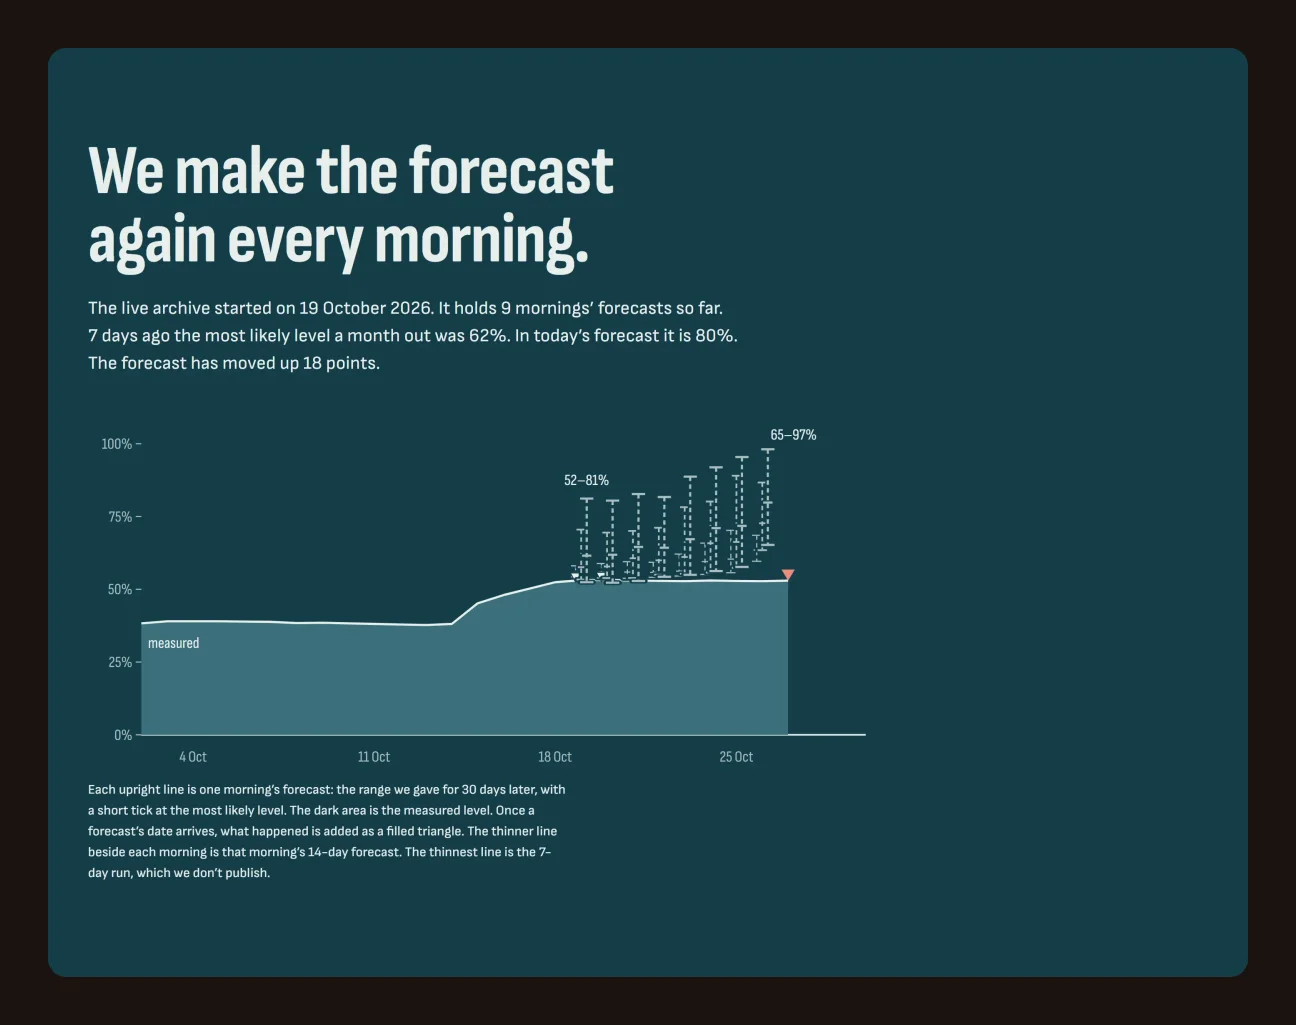
- Forecasts are immutable. Each morning's forecast is committed to the repo and never edited, and a test proves no forecast can see data from after its issue date.
- No server. GitHub Actions does the fetching, forecasting and scoring every morning. The site is static and redeploys to Cloudflare Workers after each run.
Results & evaluation
- points of fill, typical 30-day miss (hindcast, 2011–2023)
- 3.7
- smaller 30-day miss than same day last year
- 35%
- of outcomes inside the 80% range at 30 days (target: 80%)
- 85%
- past weeks re-forecast with only what was known then
- 679
Limitations & next steps
- The accuracy figures above are a hindcast: forecasts re-made for 679 past weeks using only what was known then. The first live 14- and 30-day results are due on 2 November 2026.
- The live record so far is a warning: the shorter 1–13-day runs, which the model makes but the site doesn't publish, have all 36 come in too high. The site shows that on its scorecard rather than hiding it.
- At 60–90 days the model has no clear edge over the best simple rule, so those are shown only as labelled scenarios. Ranges made in autumn run too narrow: 72% of outcomes inside at 90 days, against a target of 80%.
- It forecasts the whole city, not single dams, and it cannot foresee restrictions, closures or snow.
- Next: find why the short runs run high, build up a live track record, and ask İSKİ for its dead-storage figures.